Introduction
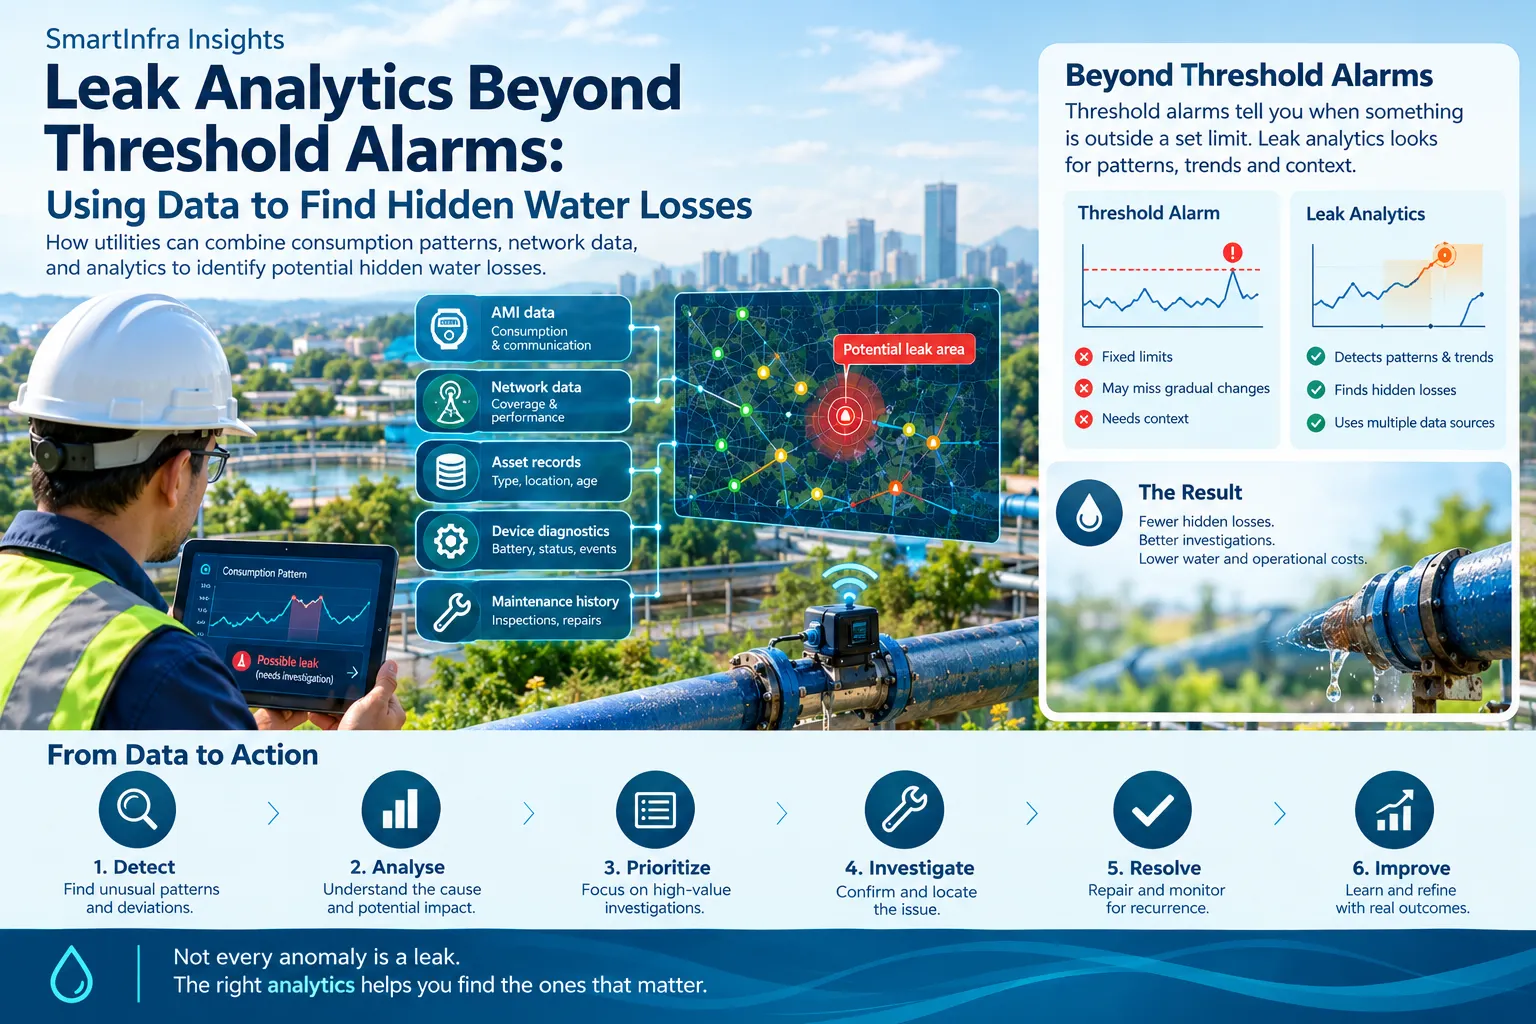
A water leak does not always trigger an alarm.
It may begin as a small, persistent increase in consumption. It may occur at night when demand is normally low, develop gradually, remain within predefined thresholds or be hidden by gaps in meter readings.
For water utilities, the challenge is not simply detecting unusual readings. It is distinguishing meaningful signals from normal variations in consumption and deciding which situations deserve investigation.
Traditional threshold alarms remain useful. But identifying potential hidden water losses requires a broader view of consumption patterns, behaviour over time and evidence from multiple sources.
Key Takeaways
- Fixed threshold alarms are useful but may miss gradual or persistent changes.
- Consumption baselines help identify deviations from expected customer or network behaviour.
- Continuous-flow, overnight-flow, persistence and trend analysis can reveal patterns that individual readings may not show.
- Customer-level analytics and DMA-level analysis provide different but complementary evidence.
- AMI readings should be combined selectively with zone inflow, pressure, SCADA, GIS and field investigation records.
- Reading frequency, meter resolution, missing data and time alignment directly affect analytical reliability.
- An anomaly is not proof of a leak.
- Rules, statistical methods and machine learning should be selected according to the problem and available evidence.
- Analytics must connect to investigation, confirmation and operational feedback.
- The objective is to find the right cases earlier, not simply generate more alerts.
Why Threshold Alarms Are Not Enough
Threshold-based monitoring is straightforward. A system triggers an alert when a measurement exceeds a predefined limit.
For example, a utility may flag unusually high consumption, continuous flow or a reading that exceeds a configured threshold.
These rules are easy to understand and can be effective when the condition is clear. However, several limitations emerge in real deployments.
Fixed Thresholds May Miss Gradual Changes
A small increase in consumption may remain below an alarm limit for weeks or months. Yet the cumulative volume can become significant if the flow continues.
Normal Behaviour Differs Between Customers
A consumption level that is unusual for a household may be normal for a commercial property.
A single threshold applied across different customer types can generate excessive alerts or miss meaningful deviations.
Intermittent Readings Can Obscure Patterns
Communication failures, delayed uploads, missing intervals and irregular reporting can make it difficult to distinguish genuine consumption behaviour from incomplete data.
An Unusual Reading Does Not Establish the Cause
High consumption may indicate a leak, but it can also result from legitimate usage, a change in occupancy, irrigation, plumbing work or a meter-related issue.
Threshold alarms remain an important first layer. The limitation is treating every threshold crossing as a complete diagnosis — or assuming that everything below the threshold is normal.
What Leak Analytics Adds
Leak analytics examines relationships across time and, where available, across different data sources.
Instead of asking only whether consumption exceeded a limit, it asks whether observed behaviour differs from what would normally be expected.
Continuous-Flow and Low-Demand Analysis
A household that continues to register flow during periods when consumption is usually low may warrant investigation.
Repeated overnight flow can be a useful signal, particularly when the pattern persists over several nights.
However, overnight consumption is not automatically a leak. Some properties have legitimate continuous demand, and meter resolution or reporting intervals may limit what can be inferred.
The analytical value comes from examining persistence, magnitude, historical behaviour and relevant property context.
Baseline Deviation
A consumption baseline represents the expected behaviour of a customer, property or network segment.
Analytics can compare recent observations with historical patterns, accounting where possible for recurring daily or weekly behaviour and seasonal changes.
For example, a property may show a gradual increase in minimum overnight consumption over several weeks. Each individual reading might remain below a fixed alarm threshold, but the trend could justify further investigation.
A baseline is not necessarily a single fixed number. It may need to adapt as legitimate usage changes.
However, poorly designed adaptive baselines can create their own problems. If a persistent leak becomes part of the historical norm, an adaptive model may gradually treat the abnormal behaviour as expected. Baselines therefore need appropriate monitoring and reset rules.
Persistence and Recurrence
The duration and recurrence of an unusual pattern can matter as much as its peak value.
A short spike may reflect normal activity. A modest but persistent flow may be more operationally significant.
Analytics can rank observations using factors such as:
- Duration
- Frequency
- Deviation from baseline
- Estimated volume
- Confidence in the available data
This helps utilities focus on patterns that may have greater consequences rather than responding to every isolated anomaly.
Change-Point and Trend Detection
Some losses develop progressively rather than appearing as a sudden spike.
Change-point detection looks for a shift in behaviour, while trend analysis examines how measurements evolve over time.
These techniques can help identify changes that fixed thresholds overlook.
Nevertheless, a statistical change indicates that behaviour has changed — not necessarily that a leak has occurred. Operational context and follow-up investigation remain essential.
From Individual Meters to Network-Level Insight
Customer-meter analytics is only one part of leak investigation.
Where suitable infrastructure and data are available, utilities can also compare observations across different levels of the water network.
Customer-Level Analysis
At the customer level, analytics may identify persistent low flow, unusual consumption patterns or a sustained deviation from historical behaviour.
This can help prioritise properties for customer notification or inspection.
The utility still needs to distinguish possible private plumbing leaks from meter faults, legitimate demand and other explanations.
District or Zone-Level Analysis
At district metered area (DMA) or zone level, utilities may compare inflow with estimated authorised consumption and other known adjustments.
A sustained difference may indicate apparent or real losses, but interpretation depends on measurement quality, time alignment, storage effects and the completeness of consumption data.
A simple subtraction between zone inflow and customer-meter readings is not automatically a reliable leakage estimate.
Combining Customer and Network Evidence
The strongest investigations often combine multiple signals.
For example, a rise in minimum night flow within a zone may coincide with unusual consumption patterns at several customer meters. Together, these observations can help narrow the investigation.
But the relationship is not always direct. Network leakage may occur between customer meters, while a customer-side leak may not create a clear zone-level signal.
The purpose of combining evidence is to improve prioritisation and investigation — not to claim that analytics can identify the exact leak location without supporting measurements.
Why Data Quality Determines Analytical Value
Leak analytics depends on the quality and meaning of its inputs. Several practical constraints deserve attention.
- Reading frequency: Daily readings may reveal persistent changes but may not capture short-duration events or precise flow behaviour. More frequent data can improve temporal resolution if the measurement and communication system supports it.
- Meter resolution: Small flows may fall below a meter's effective detection capability or be obscured by the available reporting format.
- Missing data: A communication outage can resemble zero consumption if missing readings are incorrectly interpreted as actual zero values.
- Time alignment: Comparisons between network inflow and customer consumption become unreliable when timestamps, aggregation intervals or reporting delays differ materially.
- Meter and asset context: Meter replacements, configuration changes, property changes and known maintenance activities can alter observed patterns.
- Data completeness: Incomplete customer registers, uncertain meter-to-property mappings or insufficient network boundary information can weaken the analysis.
These are not merely technical details. They directly affect false alarms, missed signals and the cost of field investigation.
A more sophisticated algorithm cannot reliably compensate for data that does not represent the underlying physical system.
Moving from Detection to Investigation
A useful leak analytics programme should connect its outputs to operational decisions.
A practical workflow can be organised into six steps.
Step 1: Define the Problem
Start with a specific operational question.
Is the priority to identify persistent customer-side leakage, detect unusual night flow, prioritise zones for investigation or reduce the time required to assess reported losses?
Different objectives require different data, analytical methods and validation procedures.
Step 2: Establish a Reliable Baseline
Understand normal behaviour before attempting to detect deviations.
Review historical data quality, reporting frequency, seasonal effects, known operational changes and differences between customer types or network zones.
Where historical data already contains undetected losses, take care not to treat the existing condition as an unquestioned normal baseline.
Step 3: Combine Relevant Evidence
Depending on the use case, this may include:
- AMI readings
- Zone inflow
- Pressure measurements
- SCADA data
- GIS information
- Asset records
- Previous field investigations
Not every deployment requires every source. Begin with the evidence that can materially improve the decision.
Step 4: Rank Potential Cases
A useful alert should provide more than a red indicator on a dashboard.
It should explain the observed behaviour, its persistence, the deviation from expected conditions, confidence in the available data and why the case deserves attention.
Where possible, include an estimate of potential impact. Clearly distinguish measured facts from analytical estimates.
Step 5: Investigate and Confirm
Field teams may use inspections, acoustic equipment, pressure testing, step testing or other appropriate methods to determine whether a leak exists and where further action is needed.
The appropriate method depends on the network, suspected leak type, available equipment and operating conditions.
Analytics should help direct these activities, not replace physical confirmation where it is necessary.
Step 6: Feed the Outcome Back into the System
Record whether an alert led to a confirmed leak, a meter issue, legitimate consumption, a communications problem or an inconclusive investigation.
These outcomes help utilities assess analytical performance and improve future prioritisation.
Without feedback, an alerting system can continue producing the same unhelpful signals without learning whether they lead to useful action.
Choosing Between Rules, Statistical Methods and AI
Not every leak analytics programme needs machine learning.
- Rule-based analytics: Effective when the condition is clearly defined, such as sustained flow during a specified period or repeated deviations from a known operating limit.
- Statistical methods: Useful for establishing baselines, identifying persistent deviations and detecting changes in consumption behaviour.
- Machine learning: May be useful when multiple variables and complex patterns need to be evaluated, particularly where sufficient representative data and reliable investigation outcomes are available.
More complex models introduce additional requirements: model validation, monitoring for changing conditions, explainability and controls for false positives and missed detections.
The selection should follow the operational problem and available evidence, not the popularity of a particular technology.
A transparent rule that reliably identifies a useful category of cases may provide more value than a sophisticated model whose alerts cannot be explained or acted upon.
Measuring Whether Leak Analytics Works
The number of alerts generated is not a sufficient measure of success.
Utilities should evaluate whether the analytics programme improves actual investigation and loss-management outcomes.
- Confirmed-leak rate: The proportion of investigated alerts that result in a confirmed leak, with the denominator and exclusions clearly defined.
- Time to investigation: How quickly prioritised cases reach the appropriate operational team.
- Time to repair: How long confirmed leaks take to resolve.
- Estimated water recovered: The estimated reduction in losses attributable to interventions, with assumptions and uncertainty documented.
- False-positive workload: The field effort spent investigating cases that do not result in the suspected finding.
- Detection coverage: Whether the approach identifies relevant cases that would otherwise have remained undetected.
- Cost per confirmed case: The analytical, operational and field costs required to identify and resolve a case.
Where possible, utilities should compare results against a credible baseline or control group. A reduction in water loss cannot automatically be attributed to analytics if other operational changes occurred at the same time.
The aim is to establish whether better information leads to better decisions and measurable operational value.
A Practical Starting Point for Utilities
A utility does not need to build a comprehensive AI platform before testing the value of leak analytics.
A focused pilot can begin with one well-defined problem, such as persistent overnight consumption or unusual changes in minimum night flow.
Select a representative set of customers or network zones, establish data-quality requirements and define what constitutes a useful alert.
Then measure how the alerts perform against field investigations and known operational outcomes.
If the approach improves prioritisation and the benefits justify the cost, the utility can expand the scope, integrate additional data sources and consider more advanced analytical methods.
Conclusion: The Value Is in Finding the Right Cases
Threshold alarms remain useful for identifying clearly defined conditions. But hidden water losses often require a broader view of consumption patterns, persistence, changing baselines and network behaviour.
Leak analytics can help utilities identify cases that deserve closer attention, prioritise investigations and make better use of field resources.
Its effectiveness depends on reliable data, appropriate analytical methods, operational context and feedback from confirmed outcomes.
Most importantly, an anomaly is not proof of a leak, and a model cannot eliminate the need for sound engineering judgement.
The objective is not to generate more alerts. It is to find the right cases earlier, investigate them more effectively and reduce water losses through evidence-based action.
Better leak analytics is not about finding more anomalies. It is about finding the right cases, confirming them and turning evidence into action.